3
Emil Numminen
Blekinge Institute of Technology and Kristianstad Univeristy
Ola Olsson
Kristianstad University
emil.numminen@bth.se, ola.olsson@hkr.se
Abstract
Overconfidence is a cognitive bias that most people suffer from. A person suffers from overconfidence bias when his or her own subjective estimation of an ability is significantly higher than an objective estimation of the same ability. Previous research in pedagogy has established that students suffer from overconfidence when it comes to grade prediction in business and economics. A student suffering from overconfidence bias have a propensity to study less than required since the subjective estimation of comprehension of the subject is higher than it really is when measured objectively. The implication of overconfidence is thus that a student will not fulfill his or her own full potential of learning the subject. This paper adds to the overconfidence research in pedagogy by measuring the level of overconfidence throughout an entire course to analyze the relation between learning and overconfidence. This has not been done in previous research. Students made estimation of their final exam score at five times throughout the course. Results show that students are overconfident and that they do not calibrate their expectations over time, on a general level. as they perhaps should given how they perform in learning the subject. Female students show a lower degree of overconfidence and had a higher tendency to calibrate their expectations. After having taken the exam and making a final estimation of expected grade, overconfidence drastically went down for less academic experienced students but instead increased for more academic experienced students. In this estimation less academic experienced female students even became underconfident.
Background
There are several studies (e.g. Tversky and Kahnemann, 1974; Kahnemann and Tversky, 1979) conducted on various biases and heuristics that many people are affected by. A heuristics can be defined as a mental shortcut based on one-handed information to simplify a complex setting (Lewis, 2008). The resulting cognitive systematic error is called a cognitive bias (Tversky and Kahnemann, 1974) or simply put; a bias. The problem of suffering from biases is that people do not make informative decisions since they base their decisions on one-sided information and tend not to pay attention to contradicting information (Plous, 1983). There are many types of heuristics and resulting biases, see e.g. Tversky and Kahnemann (1974), Baron (2008) or Hillbert (2012) for an extensive review, but one of the most common one is overconfidence bias (Brenner et al., 1996). A person suffers from overconfidence bias when her own subjective estimation of an ability is significantly higher than an objective estimation of the same ability (Pallier et al., 2002).
There is an extensive literature on overconfidence bias, see e.g. Skata (2008) for a review of the literature, and it has been studied in various academic disciplines as well as in various empirical settings. Hribar and Yang (2015) studied how various dimensions of overconfidence affect management forecasting, Malmandier and Tate (2005) studied the effect of overconfidence in timing decisions of when to exercise options and Ho et al. (2016) studied how overconfidence may explain the 2007-2009 financial crises. It is not only in economics psychology where overconfidence is used as an explanatory variable; Cassam (2017) argues that overconfidence is a major factor explaining diagnostic errors in medicine, Andreou et al. (2014) analyzed the effect of overconfidence for dopaminergic activity and found a positive effect. Overconfidence has also been reported in pedagogy in various studies when it comes to grade expectations. Grimes (2002) studied overconfidence measured as the difference between expected and actual score on a midterm exam and found students to suffer from overconfidence. Koku and Qureshi (2004) studied the effect of overconfidence in a setting of multiple-choice examination. Nowell and Alston (2007) studied the relation between overconfidence, measured again as the difference between expected and actual grade, and pedagogies. It is relevant to study overconfidence in a pedagogical setting of teaching and learning given the implication of the bias. A student suffering from overconfidence bias have a propensity to study less than required since the subjective estimation of comprehension of the subject is higher than it really is when measured objectively. The implication of overconfidence is thus that a student will not fulfill his or her own full potential of learning the subject. This study contributes to previous studies of overconfidence in pedagogy by studying how overconfidence evolves during a course taken by the students. Whereas previous research has measured overconfidence at one time and most often during or after the exam (e.g. Koku and Qureshi, 2004; Novell and Alston, 2007) we measure the expected grade five times during the course and after the exam. This enables us to study if there is a relation between overconfidence and how much of the course has been covered, i.e. is there a relation between overconfidence and learning.
The rest of the paper is structured as follows. Next, we will review the related literature of the areas we are analyzing. After that we will discuss how data was collected and analyzed. Finally, we will discuss and draw conclusions based on the empirical study conducted and make suggestions for further research.
Related literature
Previous studies in pedagogy has revealed that business and economics students are overconfident in their expectations of final grades for courses they have taken (Grimes, 2002; Koku and Qureshi, 2004; Novel and Alston, 2007). Research has tried to explore this overconfidence in various ways. Armstrong (2013) experimented using grades from previous year as a base for present years to predict their final scores as an assessment of their progress in an undergraduate business course. 29% of the respondents stated that grades were lower than expected whereas only 6% stated that the score was higher than expected. Further, 47% stated that they were studying more than expected for this prediction whereas only 3% were studying less. A possible implication of this is that students were overconfident given the relation between expected grades and predicted grades using previous year data versus the time spent on studies by the students. Other studies have focused on students studying intentions and the gap between expected and realized grades. Armstrong and MacKenzie (2017) found that students with high academic abilities have a smaller gap between grades and goals whereas students with high personal control have a larger gap between the same. However, the study also reports that these gaps narrows over time since students with a larger gap increased their study efforts. The effect of feedback to students on study effort and performance in pedagogy has been confirmed in several previous studies, see e.g. Hattie and Timberley (2007), Shute (2008) and Schartel (2012) for further discussions and results.
The effect of students abilities on performance has been widely studied and confirmed before. Andersson, Benjamin and Fuss (1994) and Straton and Arnold (2012) have all found positive effects on students performance in economics based previous education in math. Other factors that research have found positively related to ability and overconfidence include age, gender and previous grades. Gustavson and Hall (2011) found positive correlation between previous grades and overconfidence in library research skills. Lundeberg, Fox and Puncohar (1994) and Geffert and Christensen (1998) report gender effects when it comes to overconfidence. Male students are more inclined to overestimate their work and performance whereas female students on the other hand are more likely to underestimate their ability. Other effects of gender on grades also include choice of subject to major in. Owen (2011) found relation between grades in introductory economics courses and the propensity to major in economics for female students whereas for male students the same relation could not be observed. However, the gender effect on grade prediction and thus overconfidence is not univocal; nor Ballard and Johnson (2005) or Hossain and Tsigaris (2015) could see any significant gender effects in grade estimation in economics nor business and economics statistics courses analyzed.
Studies on the relation between age and overconfidence has revealed that age has a negative effect on overconfidence when it comes to grade prediction. Grimes (2002) found less overconfidence in older business students. This result is also confirmed by Novell and Alston (2007) in their study of economics students. Age seams to have a negative effect on overconfidence in general as suggested by several psychological studies as e.g. Hanson et al. (2008) and studies in behavioral decision making e.g. de Bruin, Parker and Fischoff (2012).
The literature review show that there is a support in the literature of overconfidence among students. Varoious research has also shown that there are factors that can explain differences in overconfidence among group of students. Our analysis will add to this literature by measuring how overconfidence evolve over an entire course and if gender and academic experience among students can explain overconfidence among students.
Method and data collection
Data for the study was collected using students taking a course in finance at Kristianstad University during the autumn 2016. This is not an introduction course in finance but designed for Bank and Finance (BF) students in their last year on the bachelor level as well as for Accounting (RR) student in their first year on the master level. Hence, students in this course have been trained for academic work during three and four years respectively. The class included 46 participants and was outnumbered by B&F students but more balances when it came to gender. The average student was 25 years old.
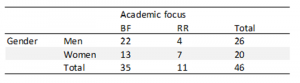
Table 1. Sample distribution
Students were asked to predict their expected score on the final examination at pre-specified times during the course on the scale 1 to 100. In this paper we call these measurement occasions (MO:s). MO1 took place during the first day after the course introduction where students were told what to expect about learning outcomes, course activities and examinations. After the second and the fourth week of the course MO2 and MO3 were done. During the last week of the course students studied on their own. MO4 took place by the end of the fifth week and only a few minutes ahead of the final exam. This was after a week of self-studies where students were given the possibility to repeat key elements of the course at home. MO5 took place a few minutes after the final exam. The data collected from MO1 to MO5 were based on student expectations of total score of the final exam measured on scale from 1 to 100 percent. This data was then compared with the data from the actual performance (MO6) as measured by e.g. Grimes (2002). All students were informed about the scoop of this study and that participation was on a voluntary basis with full confidentiality guaranteed. All data of expectations and actual performance of scores were collected in Excel and all statistical tests were done in SPSS. Given the aim of the paper and the literature review the test of overconfidence was done using t-tests and ANOVA with post doc analyze.
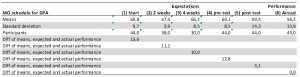
Table 2. Student expectations and performance: means and standard deviations
The data was translated into means or class grade point averages (GPA) at any given point of observations over time. The number of participants varied but this is considered in all GPA calculations as well as in all statistics below. Positive differences of means based on expected (MO 1-5) and actual performance (MO 6) indicate overconfidence. Hence, if an expected GPA was 80,0 and the actually performed GPA was 70,0 the subject would be overconfident. Table 1 above show the descriptive statistics for the GPA over time during the MO:s used in experiment. The difference in means is positive throughout the entire period but decreases in MO5. The standard deviation on the other hand increases in MO5.
Statistics and results
In this section we will present descriptive statistics of the collected data and the statistical tests for overconfidence.
Test of mean expectations
The means are tested in Table 3 to Table 6 and the results are displayed in Figure 1. All students did not participate in every observation. This will influence the mean value when you compare expectations for the same individuals over time. Our focus was the development of mean values of the expected final score on the examination. Hence, we ran paired sample t-tests to see the implications of student absence and to be able to suggest if the adjusted changes were statistically significant.
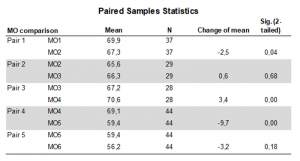
Table 3. Change of student expectations over time – statistical significance of means
The changes of expected performance means are statistically significant with 95 probability in all cases but one (Pair 2). The initial minor loss of expectation (Pair 1) was, however, recovered during the last week of the course (Pair 3) and ahead of the final examination. In addition, the dramatic change of mean values (Pair 4) was confirmed between MO4 and MO5 (-9,7). Hence, the class substantially lost momentum when it came to expectations of performance during the final examination and this change is statistically significant on a 95% level. These results suggest that GPA expectations remain on a high level during the entire course but drops significantly during the final examination. At that point standard deviation increased. This imply that the class uncertainty over the actual performance is almost the same during the course, see Table 2, but increases when the final exam is taken.
To further explore the material Table 4 and Table 5 below presents the material when it is separated based on gender and academic experience.

Table 4. Development of expectations and gender – mean and standard deviation
In general men expected higher scores than women in all observations and this was statistically significant on the 95 percent level in MO1, MO3 and MO4. In all MO:s but one (MO5) standard deviation was lower for women. Both groups kept their initial level of expectation a few minutes ahead of the final examination (compared MO1 and MO4) but made similar plunges of means in absolute numbers (expectations) after the examination was finalized (compared MO4 and MO5). Standard deviation rapidly increased for both groups after M04. The results in Table 4 indicate that both groups are overconfident. However, men indicate a higher tendency for overconfidence in relation to women throughout the course.
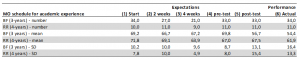
Table 5. Development of expectations and experience – mean and standard deviation
More academic experienced students participated to a higher extend in the MOs. Less experienced students kept their initial level of expectations until a few minutes ahead of the final examination (compared MO1 and MO4) but significantly lost momentum after the examination was finalized. More experienced students lost momentum already after the first MO and the mean expectations were actually the same before and after the final examination. Standard deviation did, however, rapidly increased for both groups after MO4. The results in Table 5 suggests that both groups are overconfident. These results were, however, not significant on a 95% level.
Test of overconfidence
After testing mean values of expectations Table 6, 7 and 8 present the test of overconfidence over the course for students, gender and academic experience. To do this, expected scores are compared to actual performance and the final and differences are tested through paired sampled t-tests.
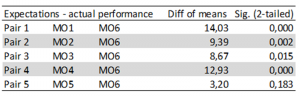
Table 6. Overconfidence over time, students – significance of means
The results in Table 6 shows that students suffers from overconfidence during the entire course and these results are statistically significant on a 95% level apart from when they have taken the exam. Overconfidence is highest in the beginning of the course and slowly decrease during the course. However, the bias remains and after the last week of preparation for the written exam the overconfidence once again rise almost to the same level as the initial level. The bias does, however, decrease directly after the final exam as expectations starts to calibrate with the actual level of performance. This result is, however, not significant on a 95% level.
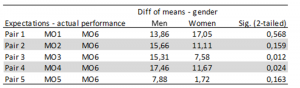
Table 7. Overconfidence over time, gender – significance of means
The results in Table 7 indicate that men and women suffers from overconfidence during the entire course. However, women show that they calibrate downwards after the last lecture of the course (pair 3). In addition, results show that men increase their overconfidence a few minutes ahead of the final exam (M04). These results are statistically significant on the 95 percent level.
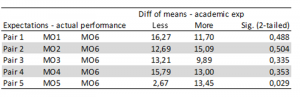
Table 8. Overconfidence over time, academic experience – significance of means
When analyzing the results from Table 8 both less and more academic experienced students seem to suffer from overconfidence during the entire course. The results indicate that less academic experienced students calibrate downwards after the final exam. In addition, the results show that more experienced students instead increase their level of overconfidence after their final exam and this result is statistically significant on the 95 percent level.
To further analyze the development of overconfidence, Figure 1 below depicts the results from an ANOVA test with post-hoc analysis for the four groups.
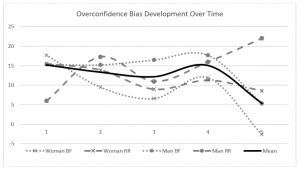
Figure 1. The development of overconfidence over time
Once again the result indicate that student overconfidence is high at start and only slowly reduce but gain new momentum ahead of the final examination as shown in MO4 in Figure 1 above. After this, overconfidence remains but on a much lower level then before as shown in MO5.
The results indicate that less academic experienced women, i.e. Woman BF in Figure 1, start off with the highest level of overconfidence but the bias fades over time. However, gain new momentum ahead of the final exam. After the final exam less academic experienced women actually indicate under-confidence as shown in MO5. Less academic experienced men, i.e. Man BF in Figure 1, start with an overconfidence level in-line with the class mean. During the course this bias grows stronger and stronger and indicate the highest level of strength just prior to the final exam. After the examination the level plunges to the level of the class mean as shown in MO5.
More experienced women, i.e. RR Women in Figure 1, start with an overconfidence level in-line with the class mean. However, the bias reduces over the course and converge to the less academic experienced women just prior to final exam. After the final exam, the overconfidence remains but on a lower level as shown in MO5. More academic experienced men, i.e. RR Men in Figure 1, start with a lowest level of overconfidence but ends up with the highest level of overconfidence as shown in Figure 1 when MO1 is compared to M05.
According to the post hoc analysis the difference between less academic experienced men and women in MO3 was statistically significant on a 95% level. This show that men were more overconfident than women, with the same academic experience, after the last lecture or one week ahead of the final exam. The post hoc analysis also showed statistical significant on the 95% level when it came to the difference between men and women with different academic experience in MO5. This show that after the final exam, men with more academic experience showed overconfidence versus women with less academic experience that showed underconfidence.
Discussion and suggestions for further research
This paper have reported the analysis of whether finance students suffer from overconfidence or under-confidence when it comes the ability to predict grades. To add to previous research the study was conducted so that level of overconfidence could be measured over an entire course. In-line with previous research, we also controlled for gender and academic experience.
The results of the analysis show that the students did exhibit overconfidence. This result is in-line with previous studies by e.g. Grimes (2002), Koku and Qureshi (2004) and Nowell and Olston (2007). Further, the results show that students on a general level do not calibrate their expectations during the course as a response to their learning since overconfidence remains significant throughout all occations of measment. Results could also to some extent confirm a gender difference in overconfidence as in previous studies by Lundeberg, Fox and Puncohar (1994) and Geffert and Christensen (1998). Male students showed increased overconfidence after the last lecture in the course and before going to take the final exam, compared to initial estimation. In addition, female students showed reduced overconfidence after the final lecture. However, results could not show any other gender effects in the beginning of the course, in the middle of the course nor after the exam was taken. Results also controlled for the academic experience effect reported by e.g. Andersson, Benjamin and Fuss (1994) and Straton and Arnold (2012). There was only a difference between more and less academic experienced students in predicting their exam score after the exam was taken. More academic experienced students did increase their expectations more than the less academic experienced students and ended up further away to the actual final score. This would imply that self-regulated learning feedback is less effective when it comes to more academic experienced students which differs from previous research. The study also found that less academic experienced women even suffered from under-confidence when given self-regulated feedback.
Implications and suggestions for further research based on this study are as follows. Given the effects of self-regulated feedback on overconfidence reported in study, it is key to implement these measures in courses continuously to control the over- or underconfidence of students. If students have a more realistic view of their performance they hopefully will also calibrate the effort needed to meet their potential. It is up to future research to analyze how these feedback measures should be designed given different various degrees of academic experience and other dimensions that might matter.
References
Andersson, G., Benjamin, D. and Fuss, M. A. (1994) “The Determinants of Success in University Introductory Economics Courses”, Journal of Economic Education, Vol. 25, No 2, pp. 99-119
Andreou, C., Moritz, S., Veith, K., Veckenstedt, R. and Naber, D. (2014) “Dopaminergic Modulation of Probabilistic Reasoning and Overconfidence in Errors: A Double-Blind Study”, Scizophrenia Bulletin, Vol. 40, No. 3, pp. 558-565
Armstrong, M. J. (2013) “A Preliminary Study on Grade Forecasting by Students”, Decision Sciences Journal of Innovative Education, Vol. 11, No. 2, pp. 193- 210
Armstrong, M. J., MacKenzie, H. F. (2017) “Influence of Anticipated and Actual Grades on Studying Intentions”, The International Journal of Management Education, Vol, 15, No. 1, pp. 49-49
Ballard, C., Johnson, M. (2005) “Gender, Expectations, and Grades in Introductory in Microeconomics in at a US University”, Femininst Economics, Vol. 11, No. 1, pp. 95-122
Baron, J. (2007) “Thinking and Deciding”, Cambridge University Press, New York
Brenner, L. A., Koehler, D. J., Liberman, V. and Tversky, A. (1996) ”Overconfidence in Probability and Frequence Judgments: A Critical Examination”, Organizational Behavior and Human Decision Processes, Vol. 65, No. 3, pp. 212-219
de Bruin, W. B., Parker, A. W. and Fischoff, B. (2012) ”Explaining Age Differences in Decision-Making Competence”, Journal of Behavioral Decision Making, Vol. 25, No. 4, pp. 352-360
Cassam, Q. (2017) “Diagnostic Errors, Overconfidence and Self-Knowledge”, Palgrave Communications, Vol. 3, pp. 1-8.
Available at: https://papers.ssrn.com/sol3/papers.cfm?abstract_id=2951662 2017-05-25
Geffert, B., Christiensen, B. (1998) “Things They Carry: Attitudes Towards, Opinions About, and Knowledge of Library and Research Among Incoming College Students”, References and User Services Quarterly, Vol. 37, No. 3, pp. 279-289
Grimes, P. (2002) “The Overconfident Priciples of Economics Student: An Examination of Metocognitive Skills”, The Journal of Economic Education, Vol. 33, No. 1, pp. 15-30
Gustavson, A., Nall, H. C. (2011) “Freshman Overconfidence and Library Research Skills: A Troubling Relationship?”, Collage and Undergraduate Libraries, Vol. 18, No. 4, pp. 291-306
Hansson, P., Rönnlund, M., Juslin, P. and Nilsson, L.-G. (2008) ”Adult age Differences in the Realm of Confidence Judgments: Overconfidence, Format Dependence, and Cognitive Predictors”, Psychology and Aging, Vol. 23, No. 3, pp. 532-544
Hattie, J., Timberley, H. (2007) “The Power of Feedback”, Review of Educational Research, Vol. 77, No. 1, pp. 88-112
Hilbert, M. (2012) “Towards a Synthesis of Cognitive Biases: How Noicy Information Processing can Bias Human Decision Making”, Psychological Bullitin, Vol. 138, No. 2, pp. 211-237
Ho, P-H., Huang, C-W., Lin, C-Y. and Yen, J-F. (2016) “CEO Overconfidence and Financieal Crises: Evidence From Bank Lending and Leverage”, Journal of Financial Economics, Vol. 120, No. 1, pp. 194-209
Hossain, B. Tsigaris, P. (2012) “Are Grade Expectations Rational?: A Classroom Experiment”, Education Economics, Vol. 23, No. 2, pp. 199-212
Hribar, P., Yang, P. (2016) “CEO Overconfidence and Management Forecasting”, Contemporary Accounting Research, Vol. 33, No. 1, pp. 204-227
Kahnemann, D., Tversky, A. (1979) “Prospect Theory: An Analysis of Decision Under Risk”, Econometrica, Vol. 47, No. 2, pp. 263-292
Koku, P. S., Qureshi, A. A. (2004) “Overconfidence and the Performance of Business Students on Examinations”, Journal of Education for Business, Vol. 79, No. 4, pp. 217-224
Lewis, A. (2008) “The Cambridge Handbook on Psychology and Economic Behaviour”, Cambridge University Press, New York
Lundeberg, M. A., Fox, P. W. and Puncohar, J. (1994) “Highly Confident but Wrong: Gender Differences and Simililarities in Confidence Judgements”, Journal of Educational Psychology, Vol. 86, No. 1, pp. 114-121
Malmendier, U., Tate, G. (2005) “CEO Overconfidence and Corporate Investment”, Journal Finance, Vol. 60, No. 6, pp. 2660-2670
Nowell, C., Alston, R. M. (2007) “I Thought I got an A! overconfidence Across the Economics Cirriculum”, The Journal of Economics Education, Vol. 38, No. 2, pp. 131-142
Owen, A. L. (2001) “Grades, Gender, and Encouragement: A Regression Discontinuity Analysis”, The Journal of Economic Education, Vol. 41, No. 3, pp. 214-234
Pallier, G., Wilkinon, R., Danthiir, V., Kleitman, S., Knezevik, G., Stankow, L. and Roberts, R. (2002) “The Role of Individual Differences in the Accuracy of Confidence Judgments”, The Journal of General Psychology, Vol. 129, No. 3, pp. 257-299
Plous, S. (1983) “The Psychology of Judgment and Decision Making”, McGraw Hill, New York
Schartel, S. A. (2012) “Giving Feedback – An Integral Part of Education”, Best Practice and Research Clinical Anesthesiology, Vol. 26, No. 1, pp. 77-87
Shute, V. (2008) “Focus on Formative Feedback”, Review of Educational Research, Vol. 78, No. 1, pp. 153-189
Skata, D. (2008) “Overconfidence in Psychology and Finance: An Interdiciplinary Literature Review”, Bank I Kredyt, No. 4, pp. 33-50.
Available at: https://papers.ssrn.com/sol3/papers.cfm?abstract_id=1261907 2017-05-25
Straton, I J. M., Arnold, J. T. (2012) ”Motivation and Math Skills as Determinants of First-Year Performance in Economics”, The Journal of Economic Education, Vol. 43, No, 1, pp. 33-47
Tversky, A., Kahnemann, D. (1974) “Judgement under Uncertainty: Heuristics and Biases”, Science, Vol. 185, No. 4157, pp. 1124-1131
